"Our Children and Grandchildren are not merely statistics towards which we can be indifferent" JFK
Showing posts with label Gallup. Show all posts

Saturday, December 10, 2011

76% of Registered Voters Say Most Members of Congress Do Not Desrve Re-election (except for their representative)

A substantial majority of Republican (75%), independent (82%), and Democratic (68%) voters agree that most members of Congress do not deserve re-election -- a sign of rare consensus about the legislative body in which both parties currently hold a leadership stake.

But Yet, 53% Say Their Representative
Deserves to be Re-elected

Gallup
By: Frank Newport
12/9/2012

PRINCETON, NJ -- About three-quarters of registered voters (76%) say most members of Congress do not deserve re-election, the highest such percentage Gallup has measured in its 19-year history of asking this question. The 20% who say most members deserve to be re-elected is also a record low, by one percentage point.


Majority Would Cast a "Yea" Vote
for Their Own Member of Congress
As has historically been the case, voters are much more positive about the U.S. representative from their own congressional district than they are about "most members of Congress," with 53% saying their representative deserves to be re-elected, while 39% hold the opposite view.


Wednesday, October 12, 2011

Congress Approval Rating ONLY 5 Points Higher than Anthony Weiner's Sex Texting Scandal

...and that I will well and faithfully discharge
the duties of the office on which I am about to enter:
So help me God.


Even at his lowest point, George Bush was 54% better than you!

In November 2008, just before the presidential election, only 20 percent approved of the job George Bush was doing as president - the lowest of any president since Gallup began asking the question in 1938.

In a recent poll, Anthony Weiner had an abysmal 8-percent approval rating among registered voters.


Gallup
By Lydia Saad
October 12, 2011

PRINCETON, NJ -- The percentage of Americans who approve of the job Congress is doing returned to 13% in October, matching the all-time Gallup low on this measure, first recorded in December 2010 and repeated in August.


Congress' approval has been low all year, registering below 20% each month since June. The latest results are based on a Gallup poll conducted Oct. 6-9.

It's Time To Focus on the Grandchildren!
You've Had Your Time and You Blew It.

Behind the recent rock-bottom ratings is subpar approval from all three party groups. Republicans' and independents' approval of Congress in 2011 has consistently been below 25%, and more often below 20%. After averaging 24% from January through July, Democrats' approval fell sharply in August, to 15%, and has remained lower than that since.

Currently, Republicans' and Democrats' approval of Congress is identical, at 14%, similar to the 13% among independents.

Older Americans are even less favorable toward Congress than the public at large. Eight percent of those 55 and older approved of Congress in October, similar to their single-digit ratings of Congress since July. Approval is not much higher among middle-aged adults, but rises to 21% among those 18 to 34. Young adults have been more supportive of Congress this year than older age groups, similar to their relatively high approval of President Barack Obama. This is consistent with previous Gallup research showing a long-term inverse relationship between congressional approval and age.


These age patterns may be even more pronounced today than historically, and could be relevant to congressional race outcomes if they hold through next year's elections, because older Americans are typically more likely to vote.

Tuesday, September 27, 2011

81% of Americans Would Throw Congress Overboard

Record-high 81% of Americans are
dissatisfied with the way the country
is being governed


16 days since returning from their August 8th to
September 5th "recess," Bipartisan Bickering continues
as they prep for their recess cocoon September 26th to
October 5th...oh, by the way, they will be on recess again from
 Ocotber 17th to Ocotber 23rd.
This is "representation" at a $174,000 annual salary...


Gallup
By Lydia Saad
September 26, 2011

PRINCETON, NJ -- A record-high 81% of Americans are dissatisfied with the way the country is being governed, adding to negativity that has been building over the past 10 years.


Majorities of Democrats (65%) and Republicans (92%) are dissatisfied with the nation's governance. This perhaps reflects the shared political power arrangement in the nation's capital, with Democrats controlling the White House and U.S. Senate, and Republicans controlling the House of Representatives. Partisans on both sides can thus find fault with government without necessarily blaming their own party.

The findings are from Gallup's annual Governance survey, updated Sept. 8-11, 2011. The same poll shows record or near-record criticism of Congress, elected officials, government handling of domestic problems, the scope of government power, and government waste of tax dollars.

Key Findings:
  • 82% of Americans disapprove of the way Congress is handling its job.
  • 69% say they have little or no confidence in the legislative branch of government, an all-time high and up from 63% in 2010.
  • 57% have little or no confidence in the federal government to solve domestic problems, exceeding the previous high of 53% recorded in 2010 and well exceeding the 43% who have little or no confidence in the government to solve international problems.
  • 53% have little or no confidence in the men and women who seek or hold elected office.
  • Americans believe, on average, that the federal government wastes 51 cents of every tax dollar, similar to a year ago, but up significantly from 46 cents a decade ago and from an average 43 cents three decades ago.
  • 49% of Americans believe the federal government has become so large and powerful that it poses an immediate threat to the rights and freedoms of ordinary citizens. In 2003, less than a third (30%) believed this.
Continue Reading and More Charts

Monday, June 20, 2011

17 Percent of Americans Approve of Congress' Job (including grandchildren, approval rate drops to 3%)


Gallup
By: Jeffrey M. Jones
June 17, 2011

PRINCETON, NJ -- Seventeen percent of Americans approve of the job Congress is doing, down seven percentage points from May's 24% approval rating, but similar to where it was in March and April. Congress' approval rating has been below 25% since January 2010.


The June 9-12 update on Congress was conducted in the midst of the scandal involving U.S. Rep. Anthony Weiner. However, the drop since May more likely reflects the end of the rally in support for the government after the death of Osama bin Laden rather than a reaction to the Weiner scandal. The bin Laden news preceded increases in approval ratings for President Obama and Congress as well as an uptick in Americans' satisfaction with the way things are going in the United States, but all three measures are back down in June.

The 17% now approving of Congress is just four points higher than the all-time low of 13% Gallup measured in December. Since Gallup began assessing congressional job approval in 1974, there have been only three ratings lower than 17%. All of these -- plus two other 17% ratings -- have been recorded in the past three years, underscoring the recent negative turn in Americans' views of Congress.

Implications
Congress' approval ratings remain historically low, and in recent years, Americans' dim view of Congress has contributed to the significant turnover in its membership after the 2006, 2008, and 2010 elections. Unless conditions in the United States improve and Americans become more charitable in their ratings of Congress, the 2012 elections may result in another shake-up in Congress' membership, although with divided control of the legislative branch, it is not clear which party would be hurt more. The irony is that even as Congress' membership has turned over a lot in recent years, its standing as an institution in the eyes of the public has not improved. Complete Report with Charts

Too bad Gallup did not include
grandchildren in their polling results


Tuesday, March 8, 2011

Americans' Optimism Slides Over 10% in February (Gallup)

If More Americans Watched CNBC,
Optimism Would Soar
It's All Good On 1st In Business Worldwide

March 8, 2011

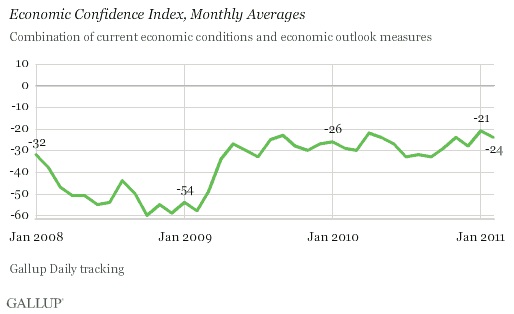
PRINCETON, NJ -- Gallup's Economic Confidence Index worsened to -24 in February from -21 the prior month as Americans' optimism about the U.S. economy receded from a three-year high reached in January.


Gallup's Economic Confidence Index is based on two questions. One measures consumers' perceptions of current economic conditions and shows them to be the same in February as in January, with 42% of Americans rating current economic conditions "poor."

The second Index component asks Americans to rate the outlook for the U.S. economy. In February, 38% said economic conditions are "getting better," down from 41% a month earlier. However, this decline follows a January optimism level that tied for the highest since Gallup Daily tracking began in January 2008.

Optimism Declines Across Demographic Groups
More than half of Americans aged 18 to 29 and of Democrats say economic conditions are getting better. This makes them the most optimistic among key demographic groups. At the other end of the spectrum are Republicans, with 27% saying things are getting better, and older Americans, with 33% of those 55 to 64 and 30% of those 65 or older saying this.

The largest drops in optimism in February were among those 65 or older (down five points) and among upper-income Americans and those aged 50 to 64 (down four points each). Only younger Americans saw no drop in optimism between January and February. Read complete report


Monday, January 17, 2011

Gallop finds 19% of Americans are satisfied (too bad they didn't include CNBC in poll)

The current low level of satisfaction is likely
tied primarily to the economy.

The outlook for the U.S. economy has brightened, Federal Reserve
Chairman Ben Bernanke said Thursday, though he warned growth
won't be strong enough to bring down the jobless rate
as speedily as policy makers would like.
 WASHINGTON, D.C. -- Gallup finds 19% of Americans satisfied with the way things are going in the United States at this time -- essentially on par with the lowest level of the past 12 months, 17%, registered in December.


While satisfaction with the direction of the country remains stagnant, the same Jan. 7-9 poll found that Americans' approval of Congress increased to 20% from a record low of 13% in December, during the lame-duck session. This slight disconnect may reveal that Americans are hopeful about what the new Congress can accomplish, but still perceive significant problems in the United States in general.

The current low level of satisfaction is likely tied primarily to the economy. When U.S. satisfaction reached an all-time high of 71% in February 1999, 6% of Americans named the economy as the most important problem facing the country. When satisfaction fell to an all-time low of 7% in October 2008 -- amid the escalating financial crisis -- 47% said the economy was the most important problem. In the Jan. 7-9 poll, 26% choose the economy as the nation's No. 1 problem, and another 29% mention unemployment.

Despite GOP House Takeover, Republicans' Satisfaction Lower Than Democrats'

Although the poll was conducted after the new Republican-controlled House came to power last week, 13% of Republicans say they are satisfied with the way things are going in the United States, far fewer than the 27% of Democrats who say the same. Sixteen percent of independents are satisfied.

Similarly, conservatives are less than half as likely as liberals to be satisfied with the direction of the nation -- 12% vs. 27%.

Although their party now controls one house of Congress, as long as Democrats remain in control of the White House, Republicans' satisfaction is likely to remain lower than Democrats'. When President Obama took office in late January 2009, Democrats' satisfaction increased, and has remained higher than Republicans' since. Historical Gallup trends document a similar rise in satisfaction among the new president's party when George W. Bush, Bill Clinton, and Ronald Reagan took office, and this pattern of elevated satisfaction persisted throughout their presidencies.

Given that U.S. satisfaction is directly related to perceptions of the economy, improvements in the economic situation in the country in general would likely increase satisfaction across party and ideological lines. Thus, it is highly unlikely that even with an economic upturn, Republicans' satisfaction would eclipse Democrats' in the near term.


Monday, December 20, 2010

17% of Americans Satisfied (Gallup)


Gallup
by Jeffrey Jones
Complete report with charts
12/20/10

PRINCETON, NJ -- Seventeen percent of Americans say they are satisfied with the way things are going in the United States at this time, the low point in a year when satisfaction levels generally have been in the 20% range.

The current 17% satisfaction rating is low from a historical perspective, but still exceeds the all-time low, 7% in an October 2008 poll. Gallup first asked this trend question in 1979.

More generally, satisfaction averaged 22% this year, lower than all but three yearly averages -- 2008 (15%), 1979 (19%), and 1992 (21%). The historical average across all years is 40%, and the yearly averages have been below that mark since 2006.

The United States' continuing economic struggles are likely the reason behind the low satisfaction levels. Gallup's "most important problem" question confirms this, as 30% of Americans say the economy in general is the top problem and 24% say unemployment or jobs specifically, easily the top two issues mentioned. Thirteen percent mention dissatisfaction with the government, 10% the federal budget deficit, and 8% healthcare.

Implications
Americans end the year in a rather sour mood, with only 17% satisfied with the way things are going in the United States. Satisfaction has been below the historical average in each of the last five years, and has recovered only modestly from the record lows of 2008. Satisfaction levels will probably not show sustained improvement until the economy turns around, as the economy typically weighs heavily in Americans' assessments of whether they are satisfied or dissatisfied with conditions in the United States.


Wednesday, December 15, 2010

Congress' Job Approval Rating Worst in Gallup History

83% disapproval rating
Worst in 30 years! And we elect them?

Gallup
by Jeffrey M. Jones
12/15/10

PRINCETON, NJ -- Americans' assessment of Congress has hit a new low, with 13% saying they approve of the way Congress is handling its job. The 83% disapproval rating is also the worst Gallup has measured in more than 30 years of tracking congressional job performance.


The prior low approval rating for Congress was 14% in July 2008 when the United States was dealing with record-high gas prices and the economy was in recession.

The current results are based on a Dec. 10-12 Gallup poll, conducted as Congress is finishing work on an important lame-duck session. The session has been highlighted by the agreement on taxes forged last week by President Obama and Republicans in Congress. The tax deal preserves the 2001 and 2003 income tax rates for all Americans for two years, revises the estate tax, extends unemployment benefits for the long-term unemployed for a year, and reduces payroll taxes for American workers. It is expected to pass despite vocal opposition from some lawmakers.

Americans are generally more positive than negative toward the deal, but many Democrats in Congress oppose it.

Frustration with the tax deal among Democrats in the general population could be a major reason for Americans' historically low approval rating of Congress. That frustration could be opposition to the bill's particulars or frustration with the Democrats in Congress opposing the president's deal. Democrats' approval of Congress is down significantly, to 16% now, from 29% in November. The November poll was conducted after Republicans won control of the House of Representatives for 2011-2012 in the midterm elections, so the drop in this month's numbers is not a reaction to the Democrats' midterm losses.

Americans currently hold Congress in lower esteem for the job it is doing than at any point in the last 36 years. In the past month, many of the supporters it had, largely Democrats, appear to have become frustrated with its work. That frustration seems to be taken out more on the Democratic congressional majority than on the president, whose approval rating has been relatively stable between 44% and 46% since the election among all Americans, and between 78% and 81% among Democrats. Gallup complete report and charts


Tuesday, December 14, 2010

U.S. Confidence in Economy Declines in Early December (Gallup)

Consumers are no more optimistic about
the U.S. economy in early December 2010
than they were at this time a year ago.
(Don't share with Wall Street as they have a really good gig
going with their sugar daddy, Ben Bernanke)

Gallup
by Dennis Jacobs
Chief Economist
12/14/10

PRINCETON, NJ -- Economic confidence is deteriorating sharply at the worst possible time for the nation's retailers. Gallup's Economic Confidence Index averaged -31 over the first two weeks of December, fully offsetting November's improvement, and essentially matching the monthly readings of -29 in October and -33 in September.


Consumers are no more optimistic about the U.S. economy in early December 2010 than they were at this time a year ago.

The Economic Confidence Index consists of two sets of ratings: one involving U.S. consumers' perceptions of current economic conditions and the other involving their economic outlook. The December estimate is based on more than 5,000 interviews conducted during the two weeks ending Dec. 12, 2010.

Percentage Rating the Economy "Poor" Worsens
Across Income Groups
During the first two weeks of December, 45% of Americans rated current economic conditions "poor" -- wiping out the improvement to 41% in November, and essentially matching the 44% of October. Consumers' ratings of current economic conditions deteriorated about equally among upper-income consumers (those making $90,000 or more a year) as well as middle- and lower-income Americans (those making less than $90,000).

Americans of All Incomes Less Optimistic
About Economy's Direction
Right now, consumers' expectations for the economy are substantially worse across income groups than they were during November, with 61% now saying the economy is getting worse. During the first two weeks of December, 58% of upper-income Americans and 62% of middle- and lower-income consumers said economic conditions are "getting worse" -- a worsening from 53% and 57%, respectively, in November.

Americans' Economic Optimism
Fading in Early December
Gallup's Economic Confidence Index suggests that the sharp improvement in economic confidence seen in November may be dissipating at the worst possible time for the nation's retailers. The sour reactions of many to the Federal Reserve's efforts to pour money into the economy -- so-called quantitative easing -- may have negatively affected the economic outlook of some consumers and investors. That might also be the case with the financial difficulties in Europe. If so, the statement of the Federal Open Market Committee on Tuesday afternoon, and the reaction to it, could be more important than usual.

More likely, the government's early December report of a surprisingly high unemployment rate for November may have increased consumer worries not only about jobs but also the direction of the U.S. economy. This despite Gallup's tracking data suggesting this government report may be overstated -- at least as far as what is really taking place in the job market right now.

It also might be the case that some Americans who had hoped for increased political harmony after the midterm elections are disappointed about the current battle over the proposed extension of the Bush tax cuts and the extension of emergency unemployment insurance, particularly when so many Americans tend to support both efforts.

Regardless, consumer spending does not reflect an improving economy at this point. Add in the recent decline in economic confidence, and Christmas sales may not meet the increasing expectations that followed the success of Black Friday week.

Gallup will publish its final estimate of Christmas spending later this week. Link to complete Gallup Report


Friday, December 10, 2010

Gallup: Spending Up Slightly in November, Matching Year Ago

Self-reported spending by lower and
middle income consumers back in
"new normal" range
 
by Dennis Jacobe, Chief Economist
Gallup
12/9/10
 
 
Over the first 11 months of 2009, spending remained in a fairly tight range of $59 to $67 before hitting $72 last December. From March through July of this year, Americans' spending generally ran slightly higher than it did in 2009. Since then, however, spending has averaged slightly below its 2009 comparables and now just matches that of a year ago.
 
 
Lower- and Middle-Income Spending Back in the
"New Normal" Range
Lower- and middle-income Americans' self-reported spending averaged $56 per day during November, up from $51 in October and September's $48. Spending by this group -- those making less than $90,000 a year -- was running below the 2009-2010 "new normal" monthly spending range of $52 to $64 during September and October, but returned to that range in November. Still, their spending continues to trail 2009 comparables.
 
Upper-Income Spending Matches That of a Year Ago
Upper-income Americans' spending averaged $120 per day in November -- not much different than the $123 and $118 of the previous two months, or the $117 of a year ago. Spending among this group making $90,000 or more annually remains at the upper end of the 2009-2010 "new normal" monthly spending range of $107 to $121 per day.
 
Commentary
At this point, Gallup's self-reported spending measure suggests that the 2009-2010 "new normal" spending trend continues unabated. Consumers are holding back -- matching their anemic spending of 2009, which trails far behind their deep recessionary spending of late 2008. While spending during Thanksgiving week seems to have increased -- averaging $79 per day -- during the first week of December, it fell back once again, to a $66 average. Consumers will have to open their pocketbooks a lot this month to match or exceed December 2009's $72 spending average.
 
The recent surge in gas prices -- up 10 cents last week alone -- could increase spending. It is a key element of Gallup's overall spending measure. But a significant increase in spending will depend on a change in attitudes among lower-, middle-, and upper-income consumers.
 
In this regard, the continued good performance of the stock market, coupled with a possible extension of the Bush tax cuts, may get upper-income consumers spending during the last few weeks of 2010. These consumers have the disposable income to spend, and could add a lot of Christmas cheer if they decide to open their wallets for the last few weeks of the holiday season.
 
At the same time, Gallup's measurements suggest that the job situation could be better than the government recently portrayed it. In turn, this could bolster lower- and middle-income spending that tends to depend on jobs. The proposed continuation of extended unemployment payments could also help.
 
Grandpa: could be better than governmentr recently displayed however a potential counter to "could be" is the non-seasonally adjusted initial jobless claims released 12/9/10.Seasonally adjusted reported at 421,000 when non-seasonally adjusted (a.k.a real people in lines, cloocked in at 582,007. We shall see...
 
Whether all the efforts -- ranging from those of the Federal Reserve to those of the president and Congress -- will actually help retailers in the next few weeks is yet to be seen. Regardless, the increased optimism they create could by itself lead consumer spending to be better than expected late this holiday season.


PRINCETON, NJ -- Overall self-reported daily consumer spending in stores, restaurants, gas stations, and online averaged $66 per day in November -- up slightly from $63 in October and $59 in September, and essentially matching the $67 of November 2009.

Sunday, November 28, 2010

Recent spending trends as well as some consumer attitudes are not particularly encouraging (Gallup)

It will be most interesting to see if CNBC will apply a positive spin on the recent consumer spending data results from Gallup. Unfortunately, Gallup shares a similar CNBC cheerleader perspective on the recently released initial jobless claims.

Both focus on the seasonally adjusted figure versus noting a 55,000 increase in non-seasonally adjusted claims. One can pretend all they want with government adjusted figures, however the reality is 55,000 more people filed initial jobless claims and we as consumers do not seasonally adjust our checkbook balance.

PRINCETON, NJ -- Self-reported daily consumer spending in stores, restaurants, gas stations, and online averaged $66 per day in the week ending Nov. 21 -- not much different than the $69 of the same week in 2009 -- but below the $74 comparable of the same week in 2008.


Although the outlook for Black Friday weekend is better than it was a year ago, at first glance, recent spending trends as well as some consumer attitudes are not particularly encouraging for Black Friday and Christmas holiday sales:
  • Nine in 10 consumers say they continue to watch their spending closely -- essentially unchanged from the 89% of the same week in 2009.
  • Seventy percent say they are cutting back on their weekly spending -- consistent with the 69% of 2009.
  • Nineteen percent of Americans worry that they spent too much money "yesterday" -- also the same as in 2009.
However, despite the year-over-year comparables in actual consumer spending, there are some positives in consumer spending attitudes this month:
  • Half (51%) of Americans say they feel able right now to make a major purchase, such as a car, appliance, or furniture -- up from 46% in the same week of 2009.
  • About 6 in 10 (58%) say they feel pretty good about the amount of money they have to spend these days -- up from 54% in 2009.
  • Americans say they will spend an average of $714 on Christmas gifts this year -- up sharply from the $638 they estimated in November 2009.
Further, Gallup data also show the economic backdrop for consumer spending is improving:
  • During the week ending Nov. 21, 41% of Americans rated current economic perceptions "poor," compared with 48% during the same week in 2009
  • Gallup's U.S. unemployment rate, without seasonal adjustment, fell to 9.2% in mid-November
  • Gallup's Job Creation Index stands at +12 for the same week, with 30% of employees reporting their companies are hiring and 18% saying they are letting people go -- much better than the +1 of 2009, when 24% of employers were hiring and 23% firing, and consistent with the most recent drop in unemployment claims to 407,000 -- the lowest level since July 2008. Gallop Report

Monday, November 15, 2010

November Christmas Spending Estimate Outlook Exceeds 2009 however...

A Relatively High 34% Will Spend "Less"
on Gifts This Year
(probably has something to do with employment and
the no inflation increases in food, medical, tuition, fuel, clothing...)

By Lydia Saad
Gallup
11/15/10

PRINCETON, NJ -- Americans currently predict they will spend $714 on Christmas gifts this year -- well exceeding the $638 they forecast in November a year ago for the 2009 holiday season, but still trailing the pre-recessionary November forecasts recorded over most of the last decade.


The findings are from a Gallup poll conducted Nov. 4-7, 2010, in which respondents were asked to predict the total amount they will spend on Christmas gifts this year. The current forecast is nearly identical to Americans' October prediction of $715.

According to Gallup modeling, if the figure holds at this level through December, that would point to a roughly 2% year-over-year increase in holiday sales. Further, if consumers' spending estimate increases between November and December, as it typically does, actual retail sales could improve by closer to 4%, similar to the long-term average.

A Relatively High 34% Will Spend "Less" on Gifts This Year

Although the majority of Americans, 52%, say they will spend the same on gifts this year as in 2009, roughly a third of Americans, 34%, say they will spend less, compared with 12% saying they will spend more. That 22-percentage-point gap is nearly double the average 13-point difference between these figures over the past 20 years -- providing a note of caution to Americans' dollar spending forecast.

The current gap contrasts with a 39-point gap found in November 2008, amid the turmoil of the global economic collapse. However, in periods of relative economic prosperity, such as from 1995 through 2000, the figures were about even. Link to report with charts


Saturday, October 30, 2010

Consumer Spending in October is Anemic (Gallup)

Spending averaging $62 per day in October
-- up from September, but down from a year ago

By Dennis Jacobs
10//29/10

PRINCETON, NJ -- Americans' self-reported spending in stores, restaurants, gas stations, and online averaged $62 per day during the first four weeks of October. That figure is up from $59 in September and is about the same as the $63 figure from August. From a broader perspective, spending remains in the 2009-2010 new normal monthly average range of $59 to $72 and is far below the 2008 recessionary spending range of $81 to $114.


Weekly Self-Reported Spending Up From 2010 Lows
Gallup's consumer spending measure over the last two weeks (ending Oct. 17 and Oct. 24) has averaged $67 per day and $65 per day, respectively, slightly higher than the estimate for all of October to date. The increase is likely a result of Halloween shopping, given that in the past, Gallup has seen increases in spending during the second half of October.

The latest weekly figures are also up from late September, which saw some of the lowest spending weeks of 2010. Over the past four weeks, spending has averaged slightly below year-ago levels.


Another Tough Christmas for Retailers
While spending is up slightly in October from September, year-over-year comparisons are not encouraging, with spending remaining in the new normal range established in 2009 and continuing into 2010. In turn, this is consistent with Gallup's October Christmas spending estimate that suggests another anemic holiday season for the nation's retailers.

Continued high underemployment, at 10.0% on a not-seasonally adjusted basis, also suggests another weak Christmas spending season, as Americans who are unemployed or fearing job loss tend to spend less, even around the holidays. Further, the increasing cost of gas and other commodities may limit the ability of many Americans to spend in other areas.

While retailers may be able to encourage consumer buying with aggressive discounting, they will do so at the cost of reducing their margins. At the same time, even as consumers enjoy price discounting, they may experience a reduced selection of goods as retailers try to keep their inventories lean.

There could be better news ahead, perhaps if the Federal Reserve acts next week to promote economic growth and/or if the results of the midterm elections make some consumers feel better. Regardless, until there is an indication of significant change, Gallup's data suggest another anemic holiday sales season ahead. Gallup


Thursday, October 28, 2010

Consumers Issue a Cautious Christmas Spending Forecast

Forecasts...excluding consumer input

10/5/10: The International Council of Shopping Centers forecast 
that holiday sales will increase by 3 to 3.5 percent
from a year ago, marking the biggest jump in four years
(sales in 2006 increased 4.4 percent).

  10/6/10: National Retail Federation (NRF) Forecasts Holiday Sales
Increase of 2.3 Percent
--Total Holiday Sales Expected to Reach $447 Billion—

Forecasts...including consumer input

10/25/10: PRINCETON, NJ -- Gallup's initial measure of Americans' 2010 Christmas spending intentions finds consumers planning to spend an average of $715 on gifts, roughly on par with the $740 recorded in October 2009.

The $25 decrease in Americans' holiday spending intentions between October 2009 and October 2010 (not a statistically significant change) contrasts with a $61 year-over-year reduction in intended spending found last October and a $108 reduction found a year prior.

The muted nature of this year's decline is reflected in consumers' own evaluations of their spending changes. According to the Oct. 7-10 poll, 27% of Americans intend to spend less on Christmas gifts this year than what they spent last Christmas -- higher than the 11% who now say they will spend more, but down from the 35% and 33% in 2008 and 2009 saying they would spend less. Prior to the recent recession, Americans were much more closely divided over whether their holiday spending would exceed or trail their spending of the prior year, while more said their spending would be "about the same."


Bottom Line
Americans' average prediction of the total amount they will spend on Christmas gifts this year is not highly encouraging for retailers, who may be hoping for a return to pre-recessionary buying habits. The good news, however, is that the $25 decline in this year's October forecast is far less than what Gallup found in each of the prior two years at this stage in the season and, according to Gallup modeling, would point to a fairly flat year in holiday retail sales if it holds at this level through December. According to the National Retail Federation, there was a steep 3.9% year-over-year decline in holiday spending in 2008. Compared with that, a repeat of the "flat" holiday sales seen in 2009 may be a tolerable, if unwelcome, outcome for retailers who have grown accustomed to the new, more budget-conscious consumer.


Gallup will update this measure in early November and again in early December. The December forecast has historically been a strong indicator of the direction of holiday retail sales, forecasting the extent to which sales will be higher or lower than the previous year. The October figure is not always predictive of the December forecast, however. In 2002, consumers' estimates of how much they would spend increased between October and December; in 2007 and 2008, their estimates decreased, while in 2009, they stayed about the same.

Saturday, August 14, 2010

American's not exactly confident in television and newspapers as news sources

by Lymari Morales

In U.S., Confidence in Newspapers, TV News Remains a Rarity No more than 25% say they have a "great deal" or "quite a lot" of confidence in eithe rby Lymari Morales WASHINGTON, D.C. -- Americans continue to express near-record-low confidence in newspapers and television news -- with no more than 25% of Americans saying they have a "great deal" or "quite a lot" of confidence in either. These views have hardly budged since falling more than 10 percentage points from 2003-2007.


The findings are from Gallup's annual Confidence in Institutions survey, which found the military faring best and Congress faring worst of 16 institutions tested. Americans' confidence in newspapers and television news is on par with Americans' lackluster confidence in banks and slightly better than their dismal rating of Health Management Organizations and big business.

The decline in trust since 2003 is also evident in a 2009 Gallup poll that asked about confidence and trust in the "mass media" more broadly. While perceptions of media bias present a viable hypothesis, Americans have not over the same period grown any more likely to say the news media are too conservative or too liberal.

No matter the cause, it is clear the media as a whole are not gaining new fans as they struggle to serve and compete with growing demand for online news, social media, and mobile platforms. The Pew Project for Excellence in Journalism's annual report on the State of the News Media, released in March, found for a third straight year, only digital and cable news sources growing in popularity, while network news, local news, and newspaper audiences shrink. These findings align with a similar 2008 Gallup poll that found cable and Internet news sources growing in popularity while all others held steady or declined.

While it is unclear how much respondents factored in the online and cable offshoots of "newspapers" and "television news" when assessing their confidence in these institutions, their responses do not provide much encouragement for the media more broadly. Confidence is hard to find, even among Democrats and liberals, who have historically been the most trusting of the news media. While 18- to 29-year-olds express more trust in newspapers than most older Americans, Gallup polling has found they read national newspapers the least. Younger Americans also expressed more confidence than older Americans in several other institutions tested, including Congress, the medical system, and the criminal justice system, suggesting younger Americans are more confident in institutions in general.


Implications
With nearly all news organizations struggling to keep up with the up-to-the-minute news cycle and to remain profitable in the process, Americans' low trust in newspapers and television news presents a critical barrier to success. The Pew report asserts that 80% of new media links are to legacy newspapers and broadcast networks, making clear that traditional news sources remain the backbone of the media. But so long as roughly three in four Americans remain distrustful, it will be difficult to attract the large and loyal audiences necessary to boost revenues. Link to survey methods


What could possibly be impacting the low confidence?